Clik here to view.

A young woman uses a smartphone in Washington Square, New York. (Photo by Claudio Alvarado Solari / CC BY-NC 2.0)
From reports of potholes and broken streetlights to complaints about garbage and vandalism, cities process more non-emergency requests from residents than ever before. Baltimore, the first U.S. city to deploy a 311 system, has processed over 13 million requests since its inception.
311 started as a phone system to allow citizens to request city services. Cities are now becoming “smart” and allowing citizens to make requests online or by using mobile apps. For example, Baltimore has evolved its 311 telephone hotline service to include a website that allows residents to submit requests directly, using a computer or tablet, or via smartphone, using its mobile app. Residents can use the same service to check back on the status of their requests.
The result is a repository of data detailing the interactions between a city and its residents. Analyzing this data can help cities learn more about their residents’ needs, prioritize tasks and projects, track performance, and improve collaboration across departments. Cities committed to openness and transparency are also making this data available online so that anyone can download and analyze it.
I worked with Heroku, a cloud platform for hosting applications, to analyze publicly available 311 data from cities around the world. We’ll show what this data shows about different cities and how residents and planners can use it to improve them. Let’s take a deeper look!
How smart cities make data open
Smart cities use technology to better manage their services, and they offer open data to empower citizens. Open311 is an open standard for creating, storing, and tracking 311 requests that any city can use. Cities that implement Open311 provide access to these requests through publicly accessible URLs.
What kind of data is available through Open311? Shown below is a real-world request for fixing a broken sidewalk in Boston.
Clik here to view.

An example of an Open311 request as shown in Open311 Status. (Via Open311)
Each request contains several bits of information, including:
-
Where the request came from
-
The type of request (such as a noise complaint, litter, or abandoned property)
-
A description of the request
-
Images, photos, or other relevant media
-
The requester’s contact information (often hidden from public access)
City workers may also add data to requests as they are being worked on, including:
-
The status of the request (new, in-progress, closed)
-
The department that the request is assigned to
-
The target date for completing the request
-
Any additional internal notes about the request
The non-profit organization Code for America created the Open311 Status service to automatically monitor the Open311 requests from various cities, collecting data from each city that we can use for analysis. It provides data feeds from multiple cities under a single view. You can see how many new requests have been created over the past 48 hours, which cities are being scanned, and even click through to see individual requests.
Clik here to view.

The Open311 Status page, available at https://status.open311.org.
While each city varies slightly in how they collect data, all of them follow the same Open311 format. This allows us to easily analyze the data, which we’ll do next.
What 311 data says about a city
The data collected by a 311 service speaks volumes about a city’s quality of life, how well it communicates with its residents, and how effectively it responds to problems.
It’s important to note that this data isn’t a perfect representation of cities and may contain gaps. Since 311 requests are made by citizens, it also contains the perspectives and biases of those citizens. For example, the reporter determines whether a tree is “overgrown” or whether a homeless person sleeping is an “encampment.” We’ve seen in New York that gentrifying neighborhoods file more 311 requests. There are also technical limitations. Many cities only include data on requests that were filed electronically but not verbally through the phone system. This may bias the data by only showing complaints from those who use computers or smartphones. Also, the data may be incomplete if it failed to sync properly or the city did not update the status of requests. When we analyze the data, we need to take these limitations into account. Nevertheless, we believe the data paints an interesting picture of the problems each city faces. If you wish to analyze the data yourself, we’ll show you how at the end of this article.
Key areas of concern for residents
Let’s start by answering a basic question: What are the most common problems that residents experience? Understanding resident pain points can help departments with operational planning. For example, if a significant number of requests are about broken street lights, the city might create a plan to upgrade or replace street lights city-wide. This is what drove Chicago to develop the Chicago Smart Lighting Program, which addresses one of the top complaints reported by its citizens.
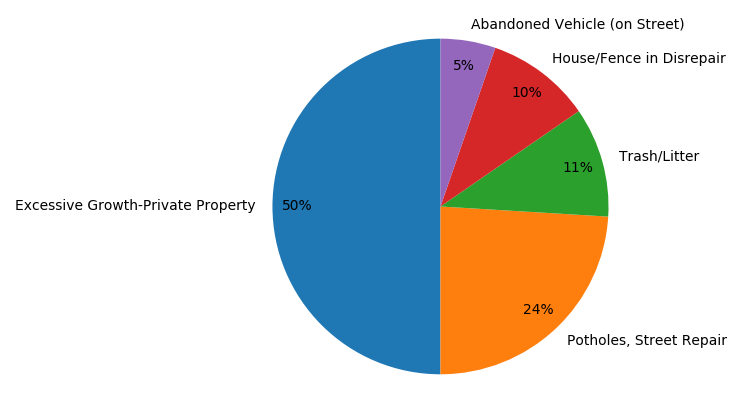
Each new Open311 request is assigned a category, which explains generally what the request is related to. The exact categories vary between cities, but all requests fall into one category. This makes it possible for us to group and count requests by category. For example, this pie chart shows the most frequently reported categories for Peoria, Illinois:
Clik here to view.

Pie chart of Open311 service request categories in Peoria, Illinois.
Excessive plant growth is by far the biggest complaint Peoria residents have, accounting for half of all requests. The city may want to issue additional notices and citations or implement new fines for unmaintained properties. However, because the definition of “excessive growth” is subjective to the person filing the 311 complaint, cities like Peoria must use caution when addressing enforcement.
Potholes and street repair make up the second most reported category of complaints, accounting for nearly one in four requests. City staff might want to send street crews to streets with the highest number of reports or allocate a larger budget towards street maintenance.
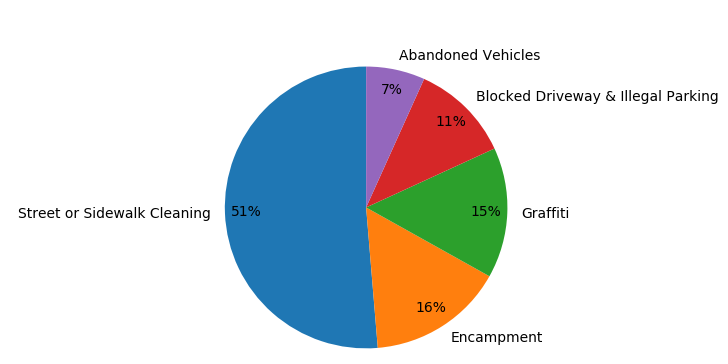
If we look at San Francisco, the top issues change drastically. With a population density over seven times that of Peoria, San Francisco’s complaints reflect those of a larger city, including trash and litter, homeless encampments, graffiti and parking.
Clik here to view.

Five most frequently reported issues in San Francisco.
How problems are distributed throughout the city
Open311 data is useful for more than just statistical and graphical analysis. With location data, we can identify exactly where a problem or request is.
Open311 supports a number of geolocation data types, including geospatial coordinates, addresses, and ZIP codes. We can easily export this data to a mapping tool. Not only does this show city workers exactly where the problem is located, but it also helps city planners determine which parts of the city are the most affected by certain request types.
We saw that San Franciscans frequently report homeless encampments. Using geolocation data, we can place each report on a map. Not only does this show city workers exactly where each report is located, but it also highlights areas in the city where encampments are most frequently reported:
Clik here to view.

Map of Open311 encampments reported in San Francisco.
Encampments appear to be more common (or are at least more commonly reported) on the eastern half of the city. Zooming in, we can see pockets of frequent encampment reports, specifically around The Castro District, Mission Dolores Park, Rincon Park, and central SoMa.
Clik here to view.

A closer look at Open311 encampment requests in San Francisco.
For planners, this makes it easier to assess requests and provide appropriate services where they are most needed.
This information has other important uses as well, such as disaster recovery. For example, if San Francisco were struck by an earthquake, planners could use a map of Open311 requests to identify areas requiring the greatest cleanup effort.
Analyze this data yourself
The open nature of the data makes it easily accessible to city planners, communities, and citizens alike. It’s a great way for so-called “citizen hackers” to learn more about their city and others around the world.
This data is available to the public and getting access is relatively easy. Since the Open311 status app is hosted on Heroku, there is a web-based tool to retrieve the latest data called Heroku Dataclips. To learn how to use it, check out our article on using Dataclips to explore the Open311 data.
If you’re interested in contributing to Open311 Status, check out the project on GitHub or find your local Code for America Brigade, where community organizers, developers, and designers put technology to work in service to their local communities.