(Credit: City of Madison)
Joining the ranks of Chicago, Los Angeles, Pittsburgh and many others, the city of Madison, Wisconsin, has built a tool to help residents visualize the data that makes municipal government tick.
Mayor Paul Soglin introduced the tool in conjunction with his 2018 capital budget last week, the Cap Times reports. It’s basically a geospatial depiction of the numbers — one-time expenses like building and infrastructure projects — in the form of a color-coded map. Madison was one of 16 cities to join Bloomberg Philanthropies’ What Works Cities initiative in October of 2016, and this project is a result of that partnership.
“What we’ve been trying to do is to take the budget off of or out of that 200-page document and create a place where somebody who’s interested can come and see what’s planned for [their] neighborhood over the next six years,” Laura Larsen, the city’s budget and program evaluation manager, told the Cap Times.
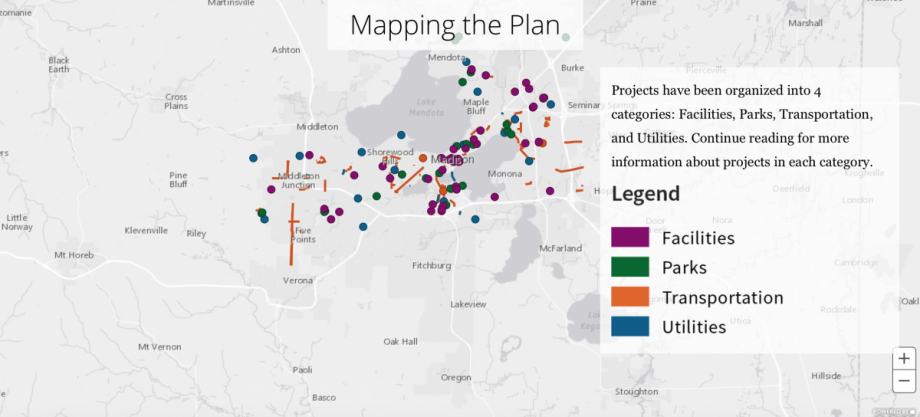
The tool is fairly simple to use and has been divided into “facilities,” “parks,” “transportation” and “utilities,” each represented by a different color. Click on one of the green dots (green for parks) and the planned project, agency and budget pops up (for example, “Northeast Park Improvements,” under the purview of the Parks Agency, for a total cost of about $6.2 million). Scroll down and the categories are further subdivided, with more information on funding sources, funding by year and separate maps that zoom in to highlight a number of projects.
Lest capital projects get all the glory, the city is working on a separate data tool that will allow residents to see the operating budget in a more dynamic way as well.